If it walks like a DUC and talks like a DUC
July 10, 2017
When natural gas producers successfully drill a new well, they do not automatically extract all the gas. Some of these wells are capped, their gas to be used another day. Many factors must be considered when making the decision to cap a well, including current prices, expected future prices, takeaway capacity, and land rents. Once a well is capped, it is labeled “drilled but uncompleted,” or a DUC (pronounced “duck”) in industry jargon, and the crew moves on to drilling the next well. Once the situation is optimal, the well is uncapped, the gas is extracted, and the well becomes “completed.”
Every month, the EIA publishes information for major drilling regions that shows how many wells were drilled, how many were completed, and how much oil and gas they produced. From these numbers, one can get a feel for the drilling characteristics of each region and the economics that drive it. For example, the Permian basin produces the second greatest amount of gas of any region, but the least amount per rig. This is because the Permian is utilized primarily for oil production and the gas that comes from the region is simply what is incidentally recovered while extracting the oil, also known as associated gas (this also means that there are a LOT of rigs in the Permian, a topic that we have discussed before).
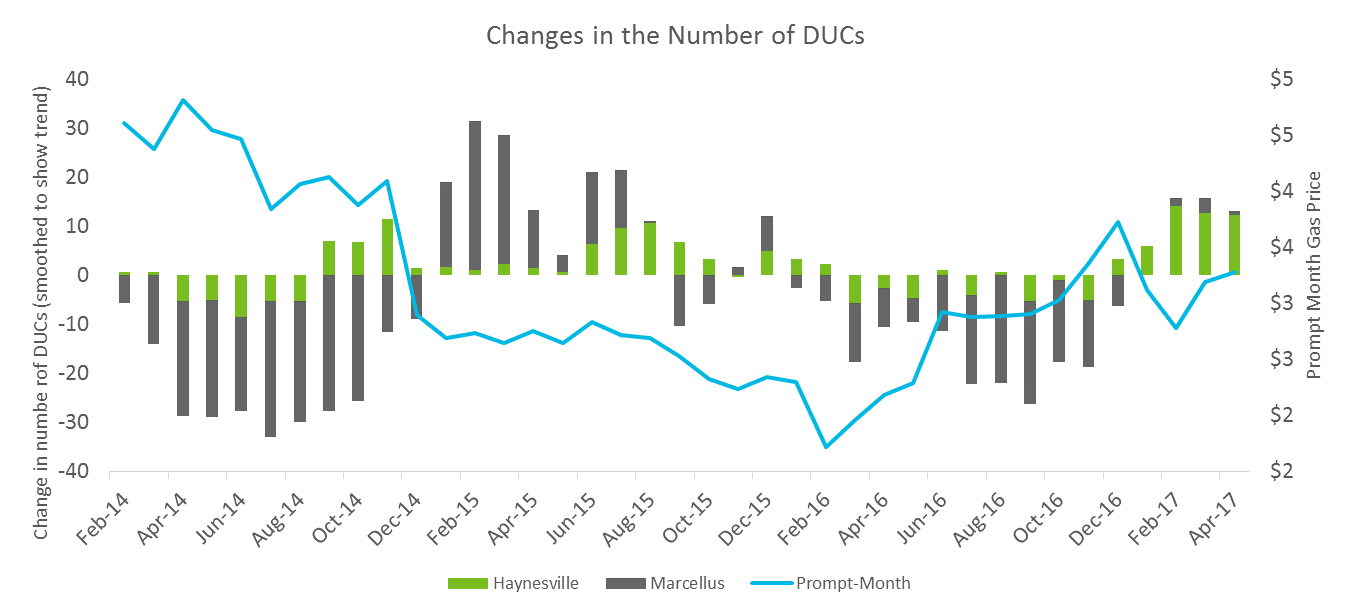
DUCs are an indicator of both the current fundamentals that are driving the exploration and production (E&P) companies running the rigs and overall cost to produce in the region. Consider the included chart that shows the change in DUCs in two of the regions that produce mainly natural gas: the Haynesville and Marcellus shales. A decrease in DUCs represents producers completing wells, thus surging production, while an increase in DUCs represents a delay in production, keeping gas in the ground for a later date.
Historically, when prices were low, E&P companies would create a surplus of DUCs to enable them to produce as much as possible when prices recovered. This is what is seen on the left side of the graph: DUCs decrease (representing surging production) in the high-price environment of late 2014 until prices crash in November. Then, on lower prices, more wells are drilled, but not completed, raising the number of DUCs and allowing production to be maximized when prices increase again.
As the low-price environment dragged on, however, a new model for using DUCs emerged. As companies struggled to remain solvent over an extended period of low incomes, DUCs came to represent an inexpensive way to get marginal gas produced, as most of the costs of extraction (i.e. the actual drilling of the well) had already been paid. This is what we see starting on the chart around August of 2015, when DUCs begin to quickly decrease in spite of prices changing relatively little.
Then, in late December of 2016, prices began to rise, at least a little. True to this new paradigm, rather than continue to utilize DUCs to surge low-cost production, drillers in the Marcellus and Haynesville begin to increase their supply of DUCs, correctly anticipating the return to low prices that we continue to see today.
It should be pointed out that this is a simplified look at how DUCs are managed by E&P companies. The final decision to uncap a well is dependent on the time, place, and local pricing and is highly technical. Most significantly, per federal law wells may only remain capped for two years, after which they must be “sealed,” meaning that the length of the well is filled with concrete. Though there are situations in which this is desirable, this law usually means that DUCs will be completed within that two year span.
While we are not sure how long this current low-price environment for natural gas will continue, producers seem to have adjusted their methods accordingly and seem to be bracing for an extended period of lower-than-average incomes. Many long range forecasts have prices in the $4.00 - $5.00 per MMBtu range over the next several years, but these are all making highly speculative assumptions about market drivers.
Few foresee the return to the $1.75 lows that we saw in 2015, however, with one or two months excluded, prices are struggling to get above $3.50. Put together with uniformly bullish long range forecasts, these facts point to a market with many upside risks that is quietly waiting to find a higher range in which to trade. Until this does happen DUCs will likely continue to be completed in times of low pricing and stockpiled in times of higher prices.