Blog
Published: August 03, 2017
An Update on California’s Aliso Canyon Natural Gas Storage Facility (Part 2)
The Aliso Canyon natural gas leak was a public health and environmental catastrophe. Thousands of families were relocated from their homes, many complaining of health issues. The damage done to...
An Update on California’s Aliso Canyon Natural Gas Storage Facility (Part 2)
August 03, 2017
Note: This is part 2 of a 2 part series on the Aliso Canyon Natural Gas Storage Facility. To read Part 1, written by Jude Clemente, on the timeline and significance of the disaster, click here.
The Aliso Canyon natural gas leak was a public health and environmental catastrophe. Thousands of families were relocated from their homes, many complaining of health issues. The damage done to the environment was incalculable and the tons of CO2E (a measure of emissions that weights gasses according to the damage they cause) more than doubled in the L.A. Valley while the leak persisted. This needs to be stated outright, as we are about to examine the market implications of the leak and the events that followed. While we are not insensitive to the impacts to the leak at Aliso Canyon, it does offer a unique opportunity to look at how the market takes changing situations into account via pricing.
When considering how natural-gas markets are impacted by potentially long-term but localized events, there are several factors to consider. The first is how to account for seasonal shifts in gas prices while the second is how to ensure that you are looking at factors that only affect a given geographic area. To account for seasonality, the standard practice is to use the price of the current trading month averaged with the following eleven months to make what is called a “twelve month strip.” By doing this you are always assured of factoring in a summer, a winter, and two shoulder seasons, meaning that any change in price is likely due to non-seasonal factors.
As to location, all natural gas delivery points in the U.S. measure their price compared to the price of gas at the Henry Hub in Louisiana. By indexing prices off of a common point, the Henry Hub price tends to move with national trends -increased supply or demand, for example- while the delivery point’s basis price will shift primarily based off regional and local trends. Through this basis pricing model we can look at regional pricing variations of only several pennies against a commodity that can swing in price more than ten times that in a day.
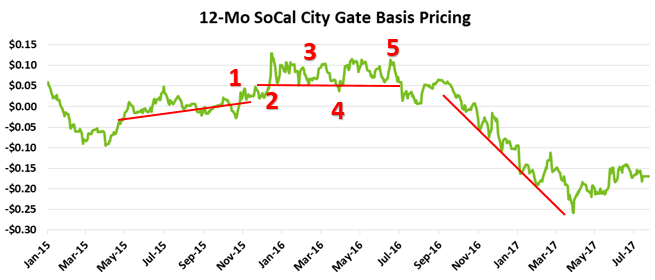
Below is a twelve month strip of the SoCal City Gate Index point from January 2015 (ten months prior to the discovery of the leak) until late July 2017. This is the natural gas delivery point that is closest to Aliso Canyon and ideally any perceptions of trouble at the storage facility would be reflected in price increases on this point.
Looking at the chart from a high level we can see that there are three main trends in this chart, indicated here by the red lines. The first is a slow increase, typically seen in markets as they price in future uncertainty. Towards the end of this line is a small downward V that represents the discovery and disclosure of the methane leak. That formation begins on October 1, 2015, troughs on October 21, then reaches a new high roughly $0.02 above the starting price on October 29 (1). On October 23, between the trough and the new high the leak was discovered and it was revealed the following day.
The second section is a period of elevated prices with choppy trading. This time, from December 2015 until late June 2016 represents the touch-and-go nature of the heart of the crisis. December 14 and 15 are the two single largest daily price changes on this chart (2), both to the upside. These occurred as LA County was suing the owner of Aliso Canyon, the FAA banned flights over the canyon, and families were actively being evacuated from the area.
Slightly after that is period of relatively stable, comparatively lower prices (3) comprising roughly the period of February 11 through 21. This begins as SoCalGas, the owner of Aliso Canyon, first announces that it has temporarily stopped the leak, then that the leaking well had been “killed.” However, the optimism is short lived, as the price jumps on the passing of a bill banning the injection of gas into the Canyon until all wells are tested to state satisfaction. Also at this time were the first private suits against SoCalGas as well as an extension of the evacuation period.
Several weeks later, prices began to decline on a lack of new news (4). Most of the news stories from this time reflect court battles over the end of the evacuation period but little else. Parks began to re-open and the Federal government pledged to look into natural gas storage regulations. It seemed that the crisis was beginning to end and normalcy returning, until April 5, when the state Public Utilities Council (CPUC) told Southern California residents that they could expect up to 14 days of rolling blackouts due to a gas shortage. This moved the price of gas upward in the region and kept it high for the next several months.
As early summer progressed and little evidence of gas shortages emerged, prices gradually began to decrease. CPUC issued an order on June 2 that allowed SoCalGas to withdraw gas from the storage facility to minimize reliability issues and that seemed to calm the market. Two weeks later (5), however, the state Division of Oil, Gas, and Geothermal resources limited this ability. This limitation, coupled with a fire at the facility on June 10, set off one final, short-lived price spike.
After late June, there was little to push the market upward. California was reaping the benefits of an oversupply of natural gas. Supply was coming in from both Canada and the Rocky mountains as new buildout from the Marcellus into the Midwest displaced gas from the Niobrara shale and decreased prices in the west. This trend continued until early this summer, when high temperatures again caused questions of reliability.
Going forward, the basis pricing in Southern California is likely to increase, though the highs seen during the Aliso Canyon leak are unlikely in the near term as increased supply is the new normal. As Aliso Canyon has recently been approved to accept limited injections, the biggest market drivers in the region are summer heat and winter precipitation. Excessive heat in the summer increases cooling load which in turn increases power generation, which is increasingly done via natural gas. Similarly, due to the minimal amount of coal generation in the region, it is hydro power that often displaces gas as the fuel of choice for generation, meaning that higher levels of precipitation can result in decreased gas prices.