Blog
Published: February 21, 2017
The U.S. Natural Gas Profile: A Guide for Domestic Consumers
All natural gas consumers should understand the dynamic U.S. gas demand structure as the competition for gas is becoming increasingly fierce. Given low prices and broadening environmental goals, natural gas is easily...
The U.S. Natural Gas Profile: A Guide for Domestic Consumers
February 21, 2017
Demand Structure
All natural gas consumers should understand the dynamic U.S. gas demand structure as the competition for gas is becoming increasingly fierce. Given low prices and broadening environmental goals, natural gas is easily our fastest growing major fuel source. Gas emits about 50% less CO2 than coal and 30% less CO2 than petroleum, and gas is now our primary source of electricity generation for the first time ever.
Moreover, given a quick “ramp up” ability of a matter of minutes, gas is the preferred backup generation fuel for naturally intermittent wind and solar power. In fact, although ranked third in the preferred “loading order” behind demand response and renewables, gas-fired generation is typically dispatched first across the grid because it is more reliable.
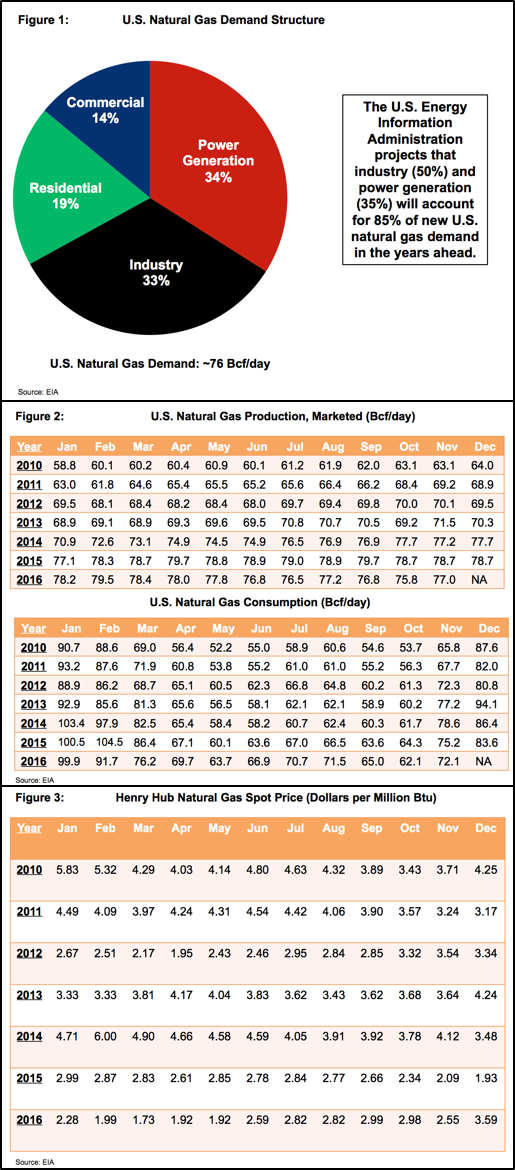
As seen in Figure 1, the versatility of natural gas explains why it is used across a variety of sectors – in contrast to coal (93% for power generation) and petroleum (75% for transportation). Thus, consumers should realize that gas faces a variety of pressure points that can increase price volatility.
Production and Consumption Patterns
The U.S. shale revolution has been in full swing since about 2010. Shale now accounts for 65% of U.S. gas production, up from less than 10% a decade ago. And shale is expected to account for nearly all incremental U.S. output in the years ahead. Likened to a manufacturing process, shale production can be brought online very quickly in response to rising prices and new infrastructure builds, thereby lowering the chance for cost spikes. For example, since 2010, monthly Henry Hub gas pricing has reached $6.00 per MMBtu or more just once (during the “Polar Vortex” in February 2014), compared to over 50 times from 2004-2008 alone.
And as demonstrated in Figure 2, shale gas production does not exhibit much seasonal variation. Even as our new gas production has shifted toward the colder Appalachia (where freeze-offs are more likely) U.S. gas production has remained very consistent throughout the year. And as an onshore phenomenon, the shale boom has offered the U.S. gas supply system a tremendous security blanket: the hurricane prone Gulf of Mexico, for instance, now accounts for just 5% of U.S. production, versus 25% in 2000.
In contrast to production, U.S. gas demand varies wildly throughout the year, climbing to as high as 135 Bcf/day on cold winter days and falling to 60 Bcf/day during the shoulder months. As gas continues to gain market share in the power sector, gas prices will be pressured on both sides of the temperature scale: increases in gas demand during heating season and increases in gas demand for power generation in the cooling season. To illustrate, hot summers can now see 70 Bcf/day in total U.S. gas demand, compared to the 55 Bcf/day seen in the hot summers before 2010.
Pricing Patterns
Counterintuitively, while heating load surges demand and maxes out pipeline capacity in the colder months, gas prices since 2010 have generally been comparable between winter and summer (see Figure 3). And based on prices patterns over the past 15 years or so, it is difficult to make definitive statements about the correlation between oil and natural gas prices. Looking forward though, the “dash to gas” does present risks for consumers: demand growth in the power generation, industrial, and export sectors could increase U.S. gas demand by 25% to 95 Bcf/day by 2020.
Exports Could Be Game Changer
U.S. natural gas consumers must also know that we are increasingly opening up our market to international buyers. Exports now appear as the only domestic demand market that could potentially spiral away from us: natural gas is expected to become the world’s primary fuel in our post-COP21 climate agreement world. The global liquefied natural gas (LNG) importing pool is projected to double to 70 nations by 2030, and hungry Asian buyers like to outbid and lower import taxes to take in more oil and gas.
U.S. natural gas is highly desirable: it’s cheaper, has more flexible contracts, and comes from a stable democracy with transparent and reliable public companies. Seven U.S. export LNG projects are currently approved, and the U.S. Energy Information Administration projects 550 U.S. LNG vessels passing through the newly expanded Panama Canal to deliver supplies to Latin America and Asia over the next few years. Overall, the U.S. could be exporting 10-12 Bcf/day by 2020, up from virtually nothing a year ago.
In just a year’s time, the U.S. has shipped LNG to nearly 20 nations, with the focus of our supplies steadily shifting across the regionalized markets, first to Latin America then to Asia and now to Europe. Today, the U.S. exports about 4 Bcf/day of gas to Mexico, 2.5 Bcf/day to Canada, and 2 Bcf/day of LNG to the world. This is some 12% of current U.S. gas production, and the export share of our output could double to 25% as soon as 2020.
The booming U.S. gas export business represents a potential concern for domestic consumers. In short, there is a huge amount of gas that will be leaving the U.S. domestic delivery system, and the more we become integrated with the globalizing gas market, the more precarious our domestic prices could become. For example, as Australia’s LNG exports have increased, gas prices in parts of the country have doubled. And this past summer, some Australian gas consumers were paying 40% more for domestic supply than Japan was paying for Australian LNG.