Blog
Published: April 03, 2018
The $13 Billion A Year Mystery: Understanding PJM's Demand Charges
PJM Interconnection, the Regional Transmission Organization that serves over 65 million people in the Mid-Atlantic and Midwest, is one of the most poorly understood entities in the U.S.’s electric landscape. PJM is the grid operator in 13 states plus Washington, DC, controlling and optimizing the flow of power through 82,000 miles of transmission lines spanning Pennsylvania, New Jersey, the Washington Beltway, and much of the Midwest.
The $13 Billion A Year Mystery: An In-Depth Understanding of PJM’s Demand Charges
April 03, 2018
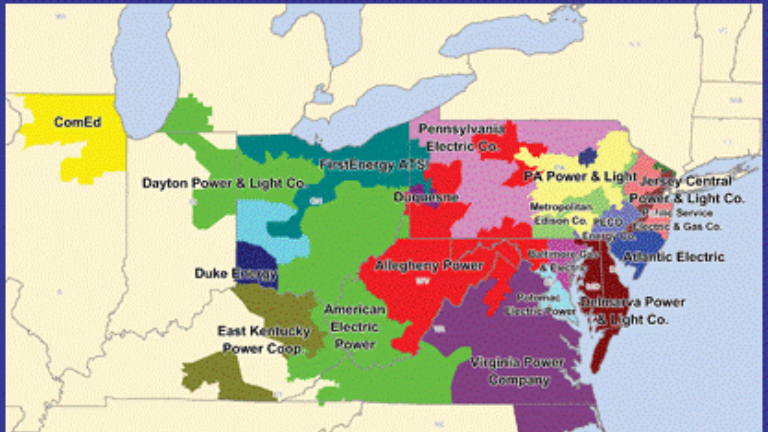
PJM Interconnection, the Regional Transmission Organization that serves over 65 million people in the Mid-Atlantic and Midwest, is one of the most poorly understood entities in the U.S.’s electric landscape. PJM is the grid operator in 13 states plus Washington, DC, controlling and optimizing the flow of power through 82,000 miles of transmission lines spanning Pennsylvania, New Jersey, the Washington Beltway, and much of the Midwest. PJM covers all of Ohio, West Virginia, and Virginia, spans as far west as Chicago and as far south as the Outer Banks of North Carolina, and yet few facilities managers are even aware of its existence, and of how important a role it plays in determining each customer’s energy bills within its footprint.
Indeed, its effect on customers’ electricity bills is nothing short of enormous: for commercial, industrial, and institutional customers within PJM’s 243,000 square-mile territory, PJM charges can account for as much as 25%, and sometimes more, of these customers’ electricity bills.
This article focuses on two large PJM charges, the PJM Capacity charge and the PJM Network Integration Transmission Service (also known as Network Transmission, or NITS) charge. These charges are both tied to customers’ kilowatt draw during the peak hours of the year. We will explore how these charges are assessed to C&I customers, how customers can reduce these costs with targeted load reduction, and how energy storage can play a key role in defraying PJM’s Capacity and Network Transmission charges.

Introduction to the PJM Interconnection
PJM describes itself as “air traffic controllers for the transmission grid.” Founded in 1927, PJM is an independent non-profit that dispatches the flow of electricity from the region’s power plants to its energy consumers. Specifically, PJM manages the high-voltage electricity lines for the utilities under its jurisdiction, allowing electrons to cross utility and state lines in a more efficient manner. PJM also creates transparent price signals in the wholesale electric markets by running markets for real-time and day-ahead power, as well as markets for ancillary services such as frequency regulation and operating reserves. Among its many mandates is reliability: it is tasked with ensuring that there is enough generation on the grid to meet worst-case scenarios, and also to ensure that there is sufficient transmission to move that electricity over a 15-year time horizon.
This reliability mandate is where PJM’s demand charges – its Capacity and Network Transmission charges – stem from. The costs of these two programs are quite significant: in 2016, PJM customers paid $9.36 billion in Capacity charges, and $4.04 billion in Network Transmission charges.[1] So how do customers get charged for these $13.4 billion in reliability costs? The methodology is very different from almost every other cost that can be found on a utility bill.
Capacity & Network Transmission: How They Are Assessed
Explaining PJM’s Capacity and Network Transmission charges involves a good bit of patience; it requires us to translate from grid-speak to consumer-speak.
Let us start with Capacity first: its role is to provide reliability, and to make sure there is enough power generation ready and available within PJM’s footprint to meet the worst-case scenario. To procure this power, PJM runs an auction, called (in classic grid-speak language) the “Reliability Pricing Model,” three years in advance. This “Base Residual Auction” occurs every May; in May 2017, for example, PJM bought 165,000 megawatts of power for the 2020-2021 Delivery Year. (PJM’s “Delivery Year” begins on June 1st and ends the following May.)
Power plants that win a share of the auction get paid by PJM in dollars per megawatt-day. Similarly, C&I customers pay this PJM Capacity charge based on a dollar per megawatt-day assessment. Since most demand charges are expressed in dollars per kilowatt monthly, it is useful to make this conversion when talking with end-users. For example, the Delivery Year 2018-2019 cost for customers in New Jersey’s PSE&G utility are charged $225.42/MW-day. This equates to $6.86 per kW each month, starting in June 2018 and ending with the May 2019 electric bill.
How is a customer’s kW measured? This part is even trickier, because the PJM methodology for assessing kW is very different than a typical utility’s. Utility demand charges are usually based off of the customer’s highest 15- or 30-minute interval of each billing month, and they reset each time. PJM’s Capacity charge, in contrast, is based off of an annual calculation that is set once, and then charged to the customer for a full year in 12 monthly installments. This is known as the Peak Load Contribution (PLC): spoken plainly, it’s the customer’s contribution to the grid’s highest peaks of the year.
To assess a customer’s Peak Load Contribution, most of PJM uses a methodology very dependent on load factor known as the 5CPs – the five coincident peaks. After the summer period is over, PJM looks back and identifies the five highest hours of load during the summer months, June through September. Then, for each C&I customer, it takes the average of the customer’s load during those five hours, and that average makes up each individual end-user’s Peak Load Contribution. Here are the five peak days from this past summer:
[1] PJM 2016 Financial Report, P. 34.
2017’s Peak Load Hours | Total Grid Consumption |
Wed., July 19th from 5-6pm | 145,331 MW |
Thurs., July 20th from 4-5pm | 145,097 MW |
Fri., July 21st from 4-5pm | 142,003 MW |
Mon., June 12th from 5-6pm | 140,660 MW |
Tues., June 13th from 4-5pm | 138,365 MW |
Historically, PJM’s peak hours have always occurred during hottest summer days: the elevated air-conditioning load sets the peak. And as you can see, the peak hours usually occur in the afternoons, from 2-6pm: this is the time when families come home, turn their A/C on full blast, and supplement the normal C&I load with additional residential consumption. Finally, by rule, each of PJM’s 5CPs comes on a separate day and must occur between June and September. A winter peak will not contribute to a PLC under the current tariff.
To see how an end-user is affected, let’s use a hypothetical example of a 50,000 square-foot office building in in northern New Jersey, 100 Main Street. Its hypothetical Peak Load Contribution is as follows:
2017’s Peak Load Hours | Total Grid Consumption | 100 Main Street’s Load at this hour |
Wed., July 19th from 5-6pm | 145,331 MW | 237 kW |
Thurs., July 20th from 4-5pm | 145,097 MW | 276 kW |
Fri., July 21st from 4-5pm | 142,003 MW | 269 kW |
Mon., June 12th from 5-6pm | 140,660 MW | 230 kW |
Tues., June 13th from 4-5pm | 138,365 MW | 262 kW |
| 100 Main Street’s PLC: | 254.8 kW |
Source: https://www.pjm.com/-/media/planning/res-adeq/load-forecast/summer-2017-pjm-5cps-and-w-n-zonal-peaks.ashx?la=en
Once a customer’s Peak Load Contribution is set, that charge will begin to show up on its electric bill every month beginning the next June; Capacity charges are offset by a year. Additionally, these Capacity costs are ratcheted. Unlike utility demand charges, which usually reset every month, PJM’s demand charges stay at the same level all year round – even during the winter, when many customer’s loads are much lower.
PJM’s Network Transmission (NITS) charges can be assessed in a similar manner. These NITS charges, which pay for transmission operation, maintenance, and upgrades across the PJM territory, are based on the customer’s kW during the single highest peak load in a customer’s zone. (Most zones correspond to utility boundaries.) The charges vary greatly from zone-to-zone: each zone has their own rules for how they calculate the NITS contribution and the overlap between RTO and zonal CPs depends greatly on the zone. Winter peaking areas (typically rural parts of PA or OH) will have less overlap between their zonal CP and the PJM CPs. In PECO zone, which comprises Philadelphia, the Network Transmission cost is $1.75 per kW each month; in PSE&G, the Network Transmission cost is $10.08 per kW, each month. PSE&G customers tend to pay the highest prices in the PJM network, year after year.
While Network Transmission peaks can occur during any month of the year, they have tended to occur at roughly the same time of the year as capacity peaks:
This is a common question by facilities managers – and for good reason. In deregulated energy markets, which comprise almost all of the PJM territory, the PJM Capacity and Network Transmission charges are very often “blended” in to the customer’s 3rd party electricity supply bill – meaning that most customers have no idea whatsoever that they exist.
This is not an insurmountable problem. When customers are re-negotiating your supply contract, they can insist that suppliers itemize each component of the customer’s costs on a line-by-line basis, so that customers can home in on those PJM demand charges, and reduce them.
Many large end-users, such as manufacturing plants and university campuses, do just this: they monitor their PJM peak hours very closely because they understand how much those five peak hours cost. Additionally, many customers look to energy-efficient and load shifting technologies to reduce their PJM Capacity and Network Transmission obligations: such technologies include high-efficiency cooling systems, LED lighting, thermal energy storage, batteries, peak load management and demand response services. There’s no reason that every customer can’t be this savvy.